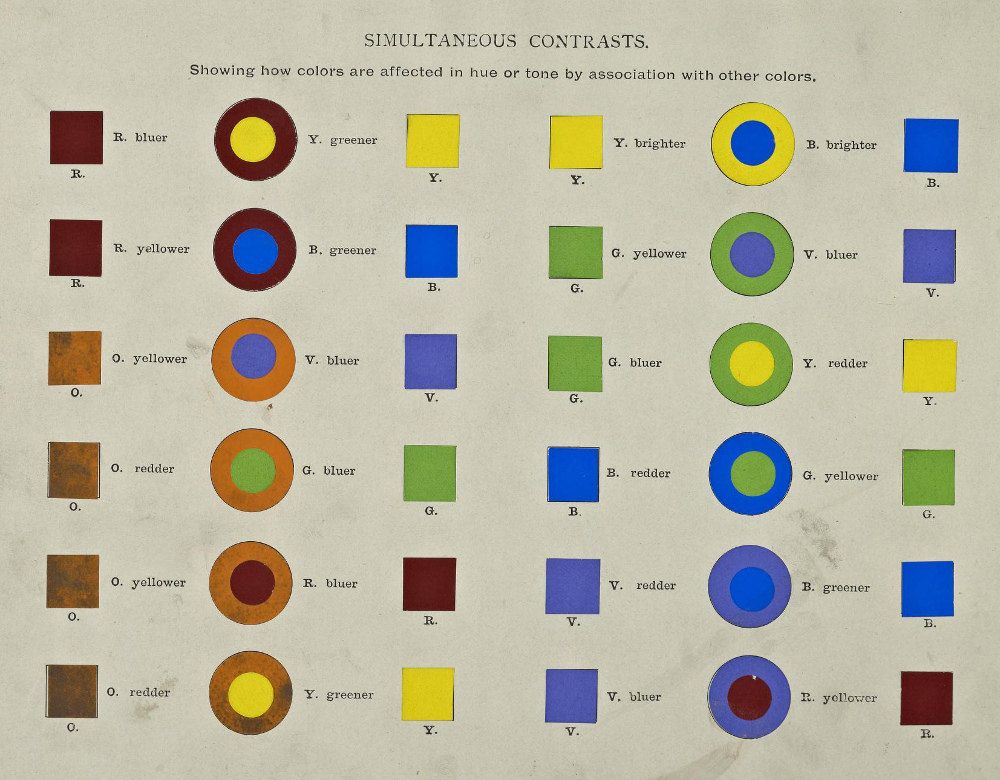
The image is a vintage scientific diagram titled "SIMULTANEOUS CONTRASTS." It demonstrates how colors are affected in hue or tone by association with other colors. The diagram consists of a grid of 24 color samples, each consisting of a small square of color next to a larger colored circle. Each sample is labeled with a letter (R, Y, O, G, B, V) representing the color of the circle, and a descriptive term indicating how the circle appears due to the adjacent square. The colors used are red (R), yellow (Y), orange (O), green (G), blue (B), and violet (V). The descriptive terms include "bluer", "greener", "brighter", "yellower", "redder". The diagram is printed on a slightly aged, off-white background. The colors appear somewhat faded, consistent with the age of the print. The overall aesthetic is that of a scientific illustration from the late 19th or early 20th century.