plategridcolortextplategridcoloranalysisyellowbluegreenteacupsaucervintagechartpercentages
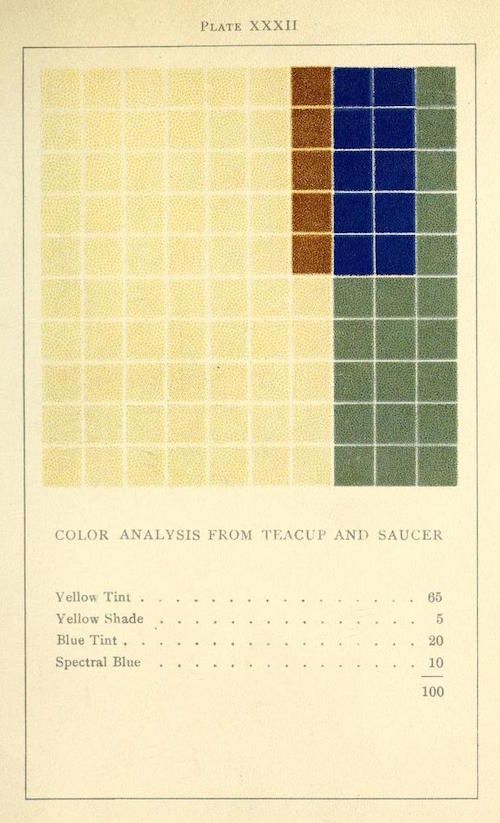
The image is a vintage-style color analysis chart, labeled 'Plate XXXII' at the top. It features a grid of small squares, each filled with a different shade of color. The colors primarily consist of various tones of yellow, blue, and green, arranged in a pattern that seems to demonstrate a color breakdown or analysis. Below the grid, there's text listing color components and their percentages: * Yellow Tint: 85 * Yellow Shade: 5 * Blue Tint: 20 * Spectral Blue: 10 The total adds up to 100, suggesting this is a breakdown of the colors found in a 'Teacup and Saucer,' as indicated by the subtitle 'COLOR ANALYSIS FROM TEACUP AND SAUCER.' The background of the image is a pale yellow, giving it an aged, historical feel.
License: CC0