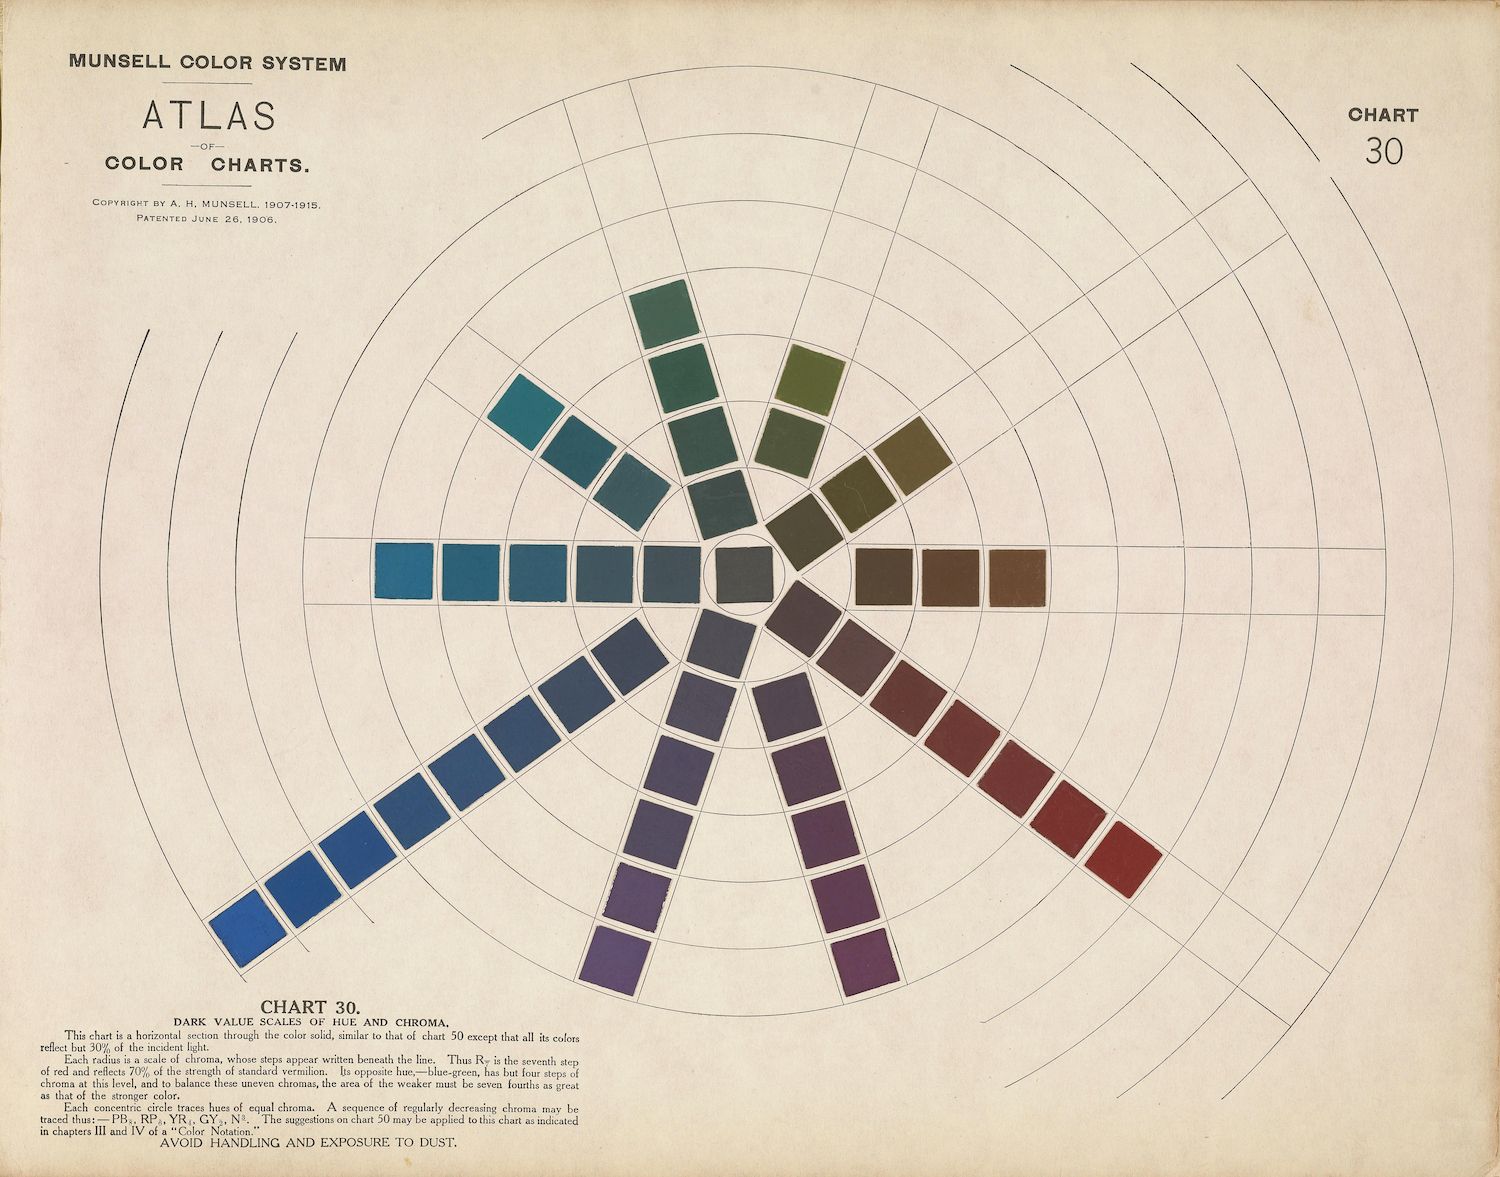
The image is a vintage chart titled "Munsell Color System Atlas, Chart 30". It's a circular diagram showcasing a spectrum of colors arranged in a radial pattern. The chart is labeled "Dark Value Scales of Hue and Chroma". The central area of the chart is a neutral gray, and radiating outwards are concentric rings of color. Each ring represents a different hue, starting with blue at the top, transitioning through greens, yellows, oranges, reds, purples, and back to blue. Within each hue, there are variations in chroma (saturation) and value (lightness), represented by squares of different shades. The colors become darker and more muted as they move towards the center of the chart. Below the chart is descriptive text explaining the chart's purpose and how to interpret the color scales. The chart is aged and shows signs of wear, with some discoloration and staining. The overall aesthetic is reminiscent of a scientific or technical illustration from the early 20th century.