chartgridcolorsquarescalecolorchartgridscalevalueschromashuevaluechromavisual representation
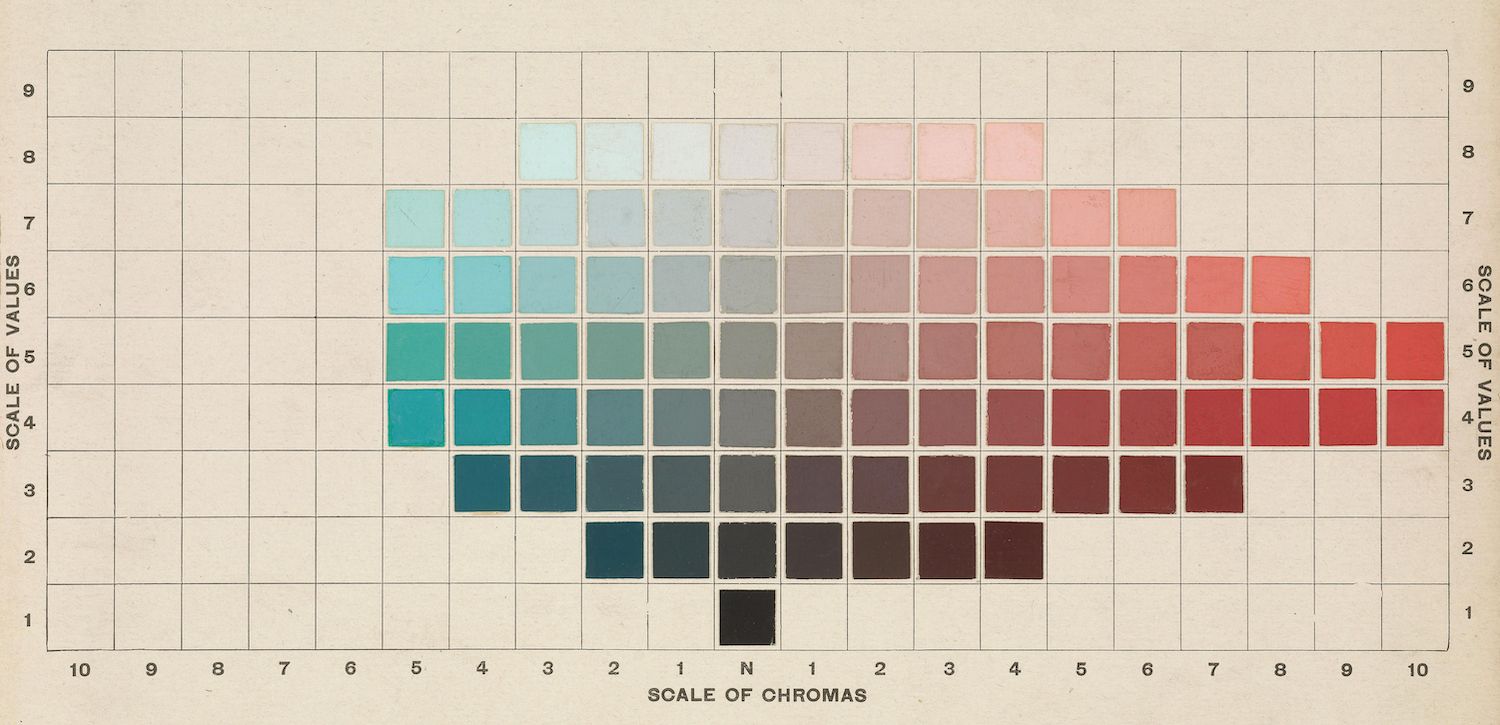
The image is a color chart with a grid-like structure. It appears to be a visual representation of color values and chromas. The chart is organized as a grid with numbers along the vertical and horizontal axes, indicating scales of values and chromas respectively. The grid is filled with squares of varying colors, transitioning from dark teal/green at the bottom left to bright red at the top right. The colors gradually change in hue, value, and chroma as you move across and up the grid. The chart is on a beige background with a fine grid pattern. The chart is labeled with 'SCALE OF VALUES' on the left and 'SCALE OF CHROMAS' on the bottom.
License: CC0