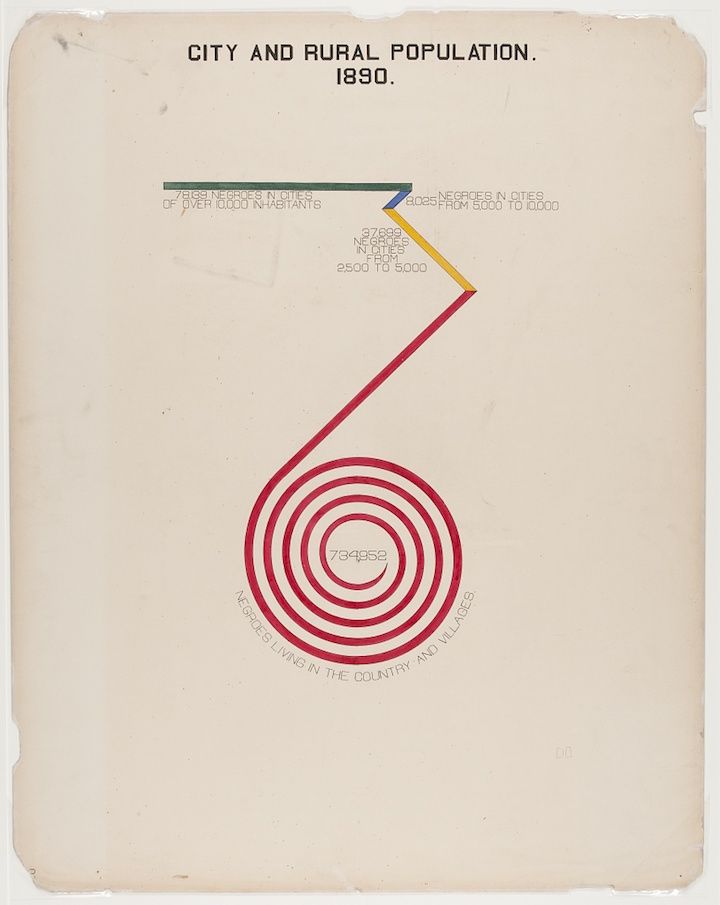
The image is a vintage diagram titled "City and Rural Population. 1890". It's a spiral chart, reminiscent of a bullseye, used to visualize population data. The chart is composed of concentric, colored bands that spiral outwards from a central point. Each band represents a different population segment. The innermost circle is black and labeled "764952" representing the population. The next band is red and labeled "37899". The next band is yellow and labeled "8025". The outermost band is blue and labeled "7869". Text is arranged around the spiral, providing context. The text reads "Negroes living in the country and villages" and "Negroes in cities of over 10,000 inhabitants". The chart is set against a cream-colored background. The overall aesthetic is reminiscent of a historical data visualization, likely from the late 19th century.