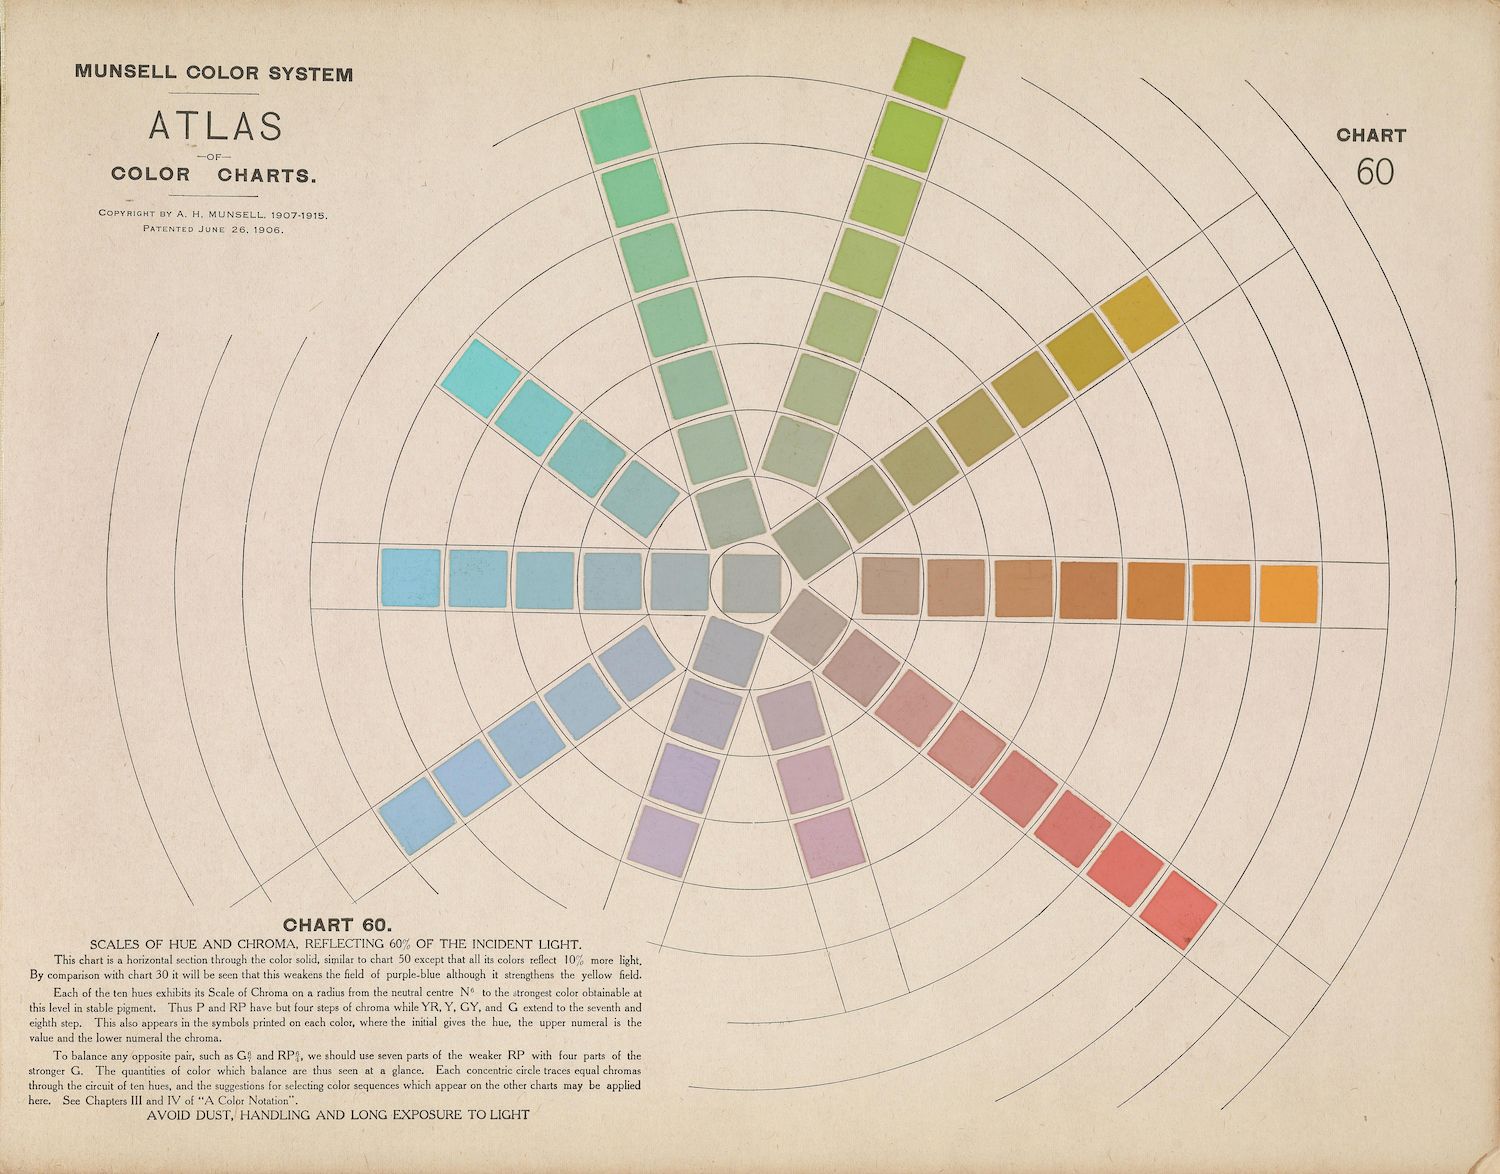
The image is a vintage chart titled "Munsell Color System Atlas - Color Charts". It's Chart 60 and features a complex color wheel. The chart is circular, with a central gray circle. Radiating outwards from this center are concentric rings of color, creating a segmented wheel. Each segment is a different hue, and within each hue, there are variations in saturation and value, creating a gradient effect. The colors range from yellows and greens to blues, purples, reds, and oranges. The segments are arranged in a way that demonstrates the relationships between different colors. Below the chart is a block of text explaining the chart's purpose and how to interpret it. It discusses hue, value, and chroma, and how they relate to the amount of incident light. There's also a warning at the bottom to avoid dust, handling, and long exposure to light. The chart has a slightly aged appearance, with some discoloration and wear, typical of vintage documents. The overall impression is one of scientific precision and artistic beauty, showcasing a systematic approach to color representation.