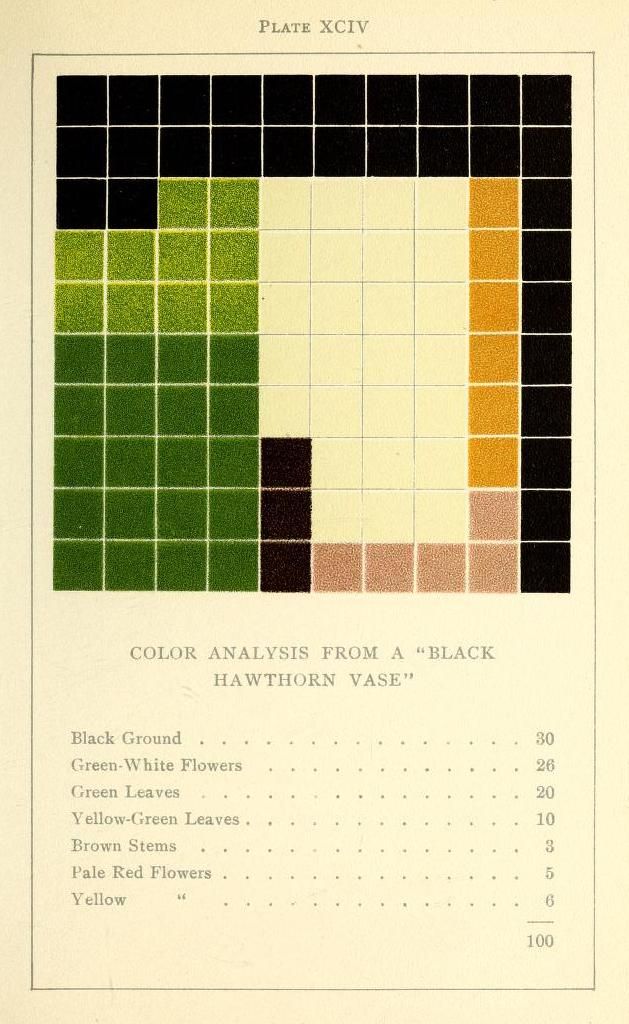
The image is a vintage color analysis chart titled "Plate XCIV" and labeled "Color Analysis From A 'Black Hawthorn Vase.'" It's a grid of 100 small squares, each filled with a different shade of color. The grid is arranged to visually represent the color composition of the vase. The colors are primarily shades of green, brown, yellow, and black. The top row is mostly black, transitioning to shades of yellow and orange in the rightmost squares. The left side is dominated by various shades of green, ranging from dark forest green to lighter, yellowish-green. There are also some squares filled with brown and pale red, representing stems and flowers. Below the grid is a list detailing the color breakdown: * Black Ground: 30 * Green-White Flowers: 26 * Green Leaves: 20 * Yellow-Green Leaves: 10 * Brown Stems: 3 * Pale Red Flowers: 5 * Yellow: 6 The total adds up to 100, indicating the percentage of each color in the overall composition of the vase. The chart has a slightly aged, sepia-toned appearance, typical of vintage prints.