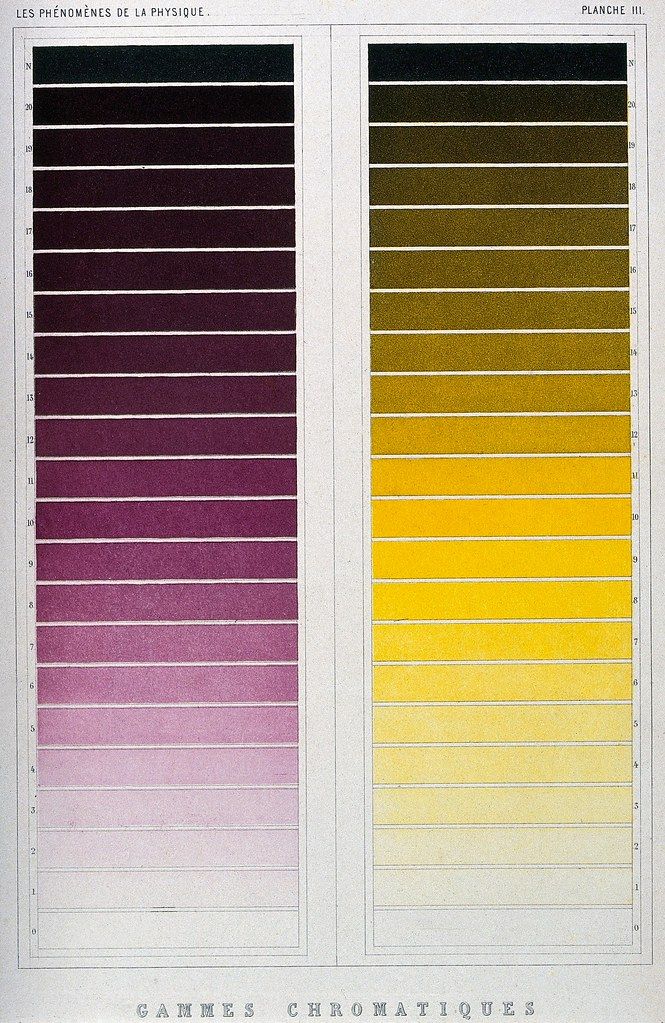
The image is a vintage scientific chart titled "Les Phénomènes de la Physique. Planche III. Gammes Chromatiques". It features two side-by-side color scales, each with 21 horizontal strips numbered from 0 to 20. The left side displays a gradient transitioning from a deep purple at the top (strip 20) to a pale pink at the bottom (strip 0). The colors gradually lighten as you move down the scale. The right side shows a gradient from a dark olive green at the top (strip 20) to a very pale yellow at the bottom (strip 0). The colors also lighten as you move down the scale. The chart appears to be a visual representation of color variations or a color scale used in a scientific context. The background is a slightly aged, off-white paper with visible texture.