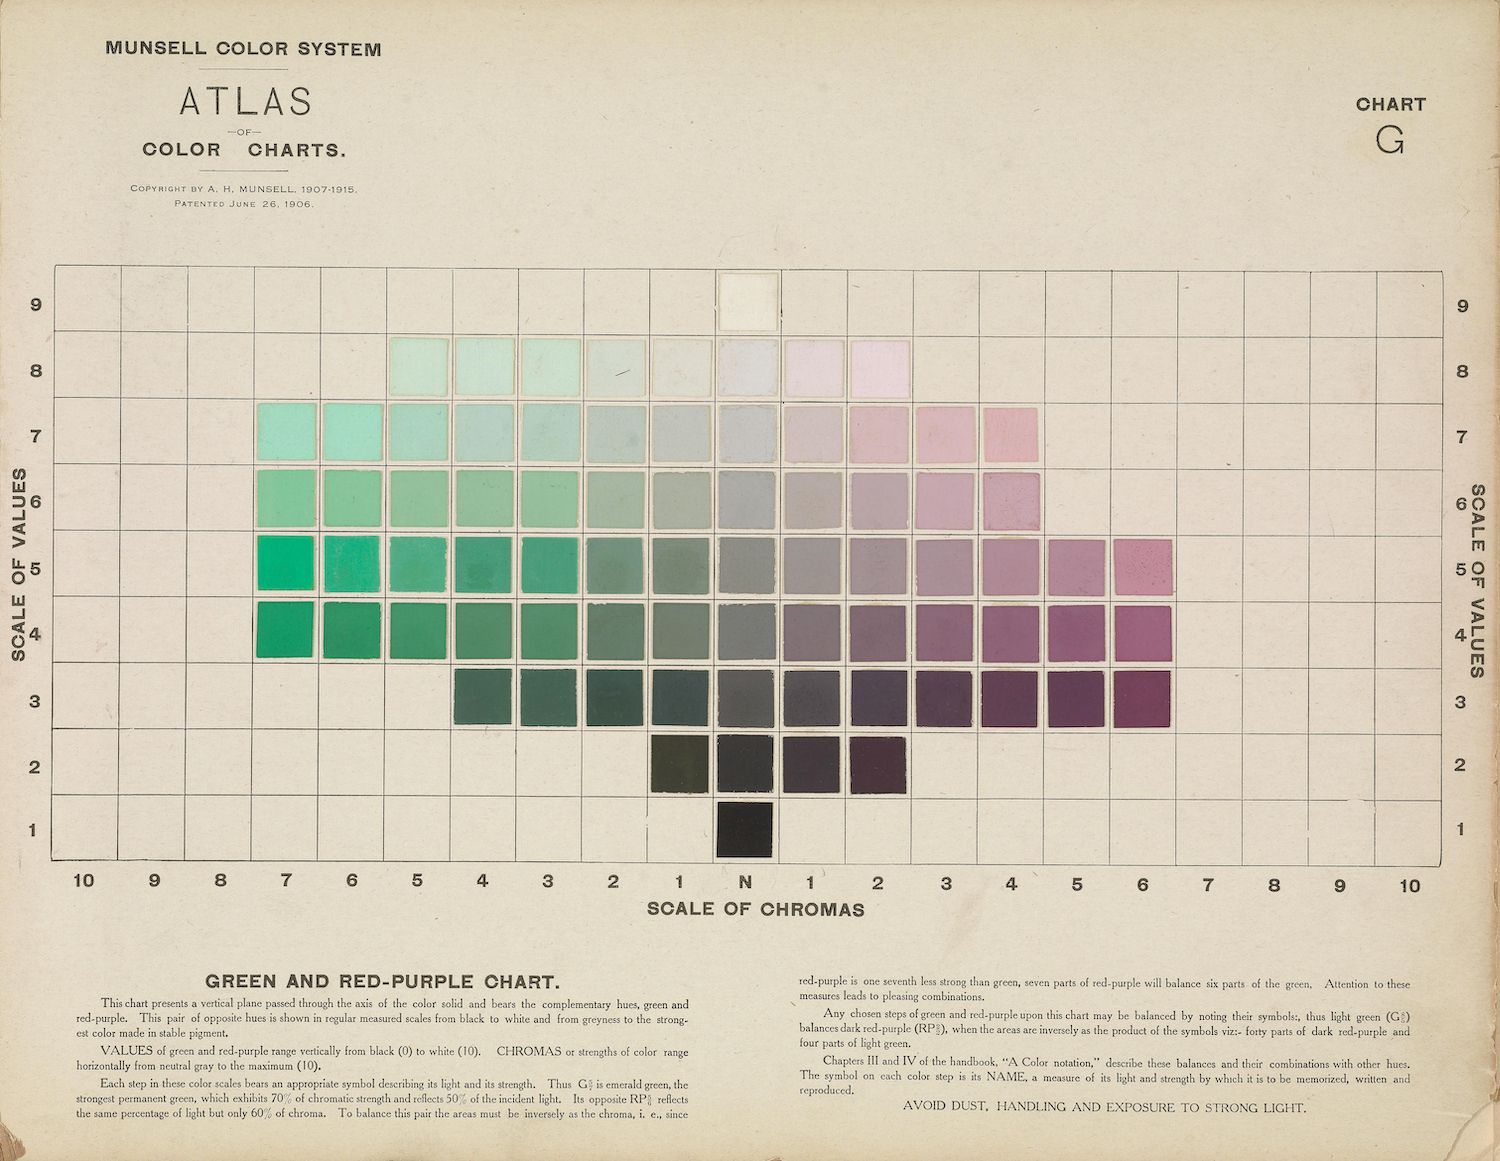
The image is a chart from the Munsell Color System Atlas, specifically Chart G, titled 'Green and Red-Purple Chart'. It's a grid-like arrangement of color swatches, organized by three scales: * **Scale of Values (Vertical):** Ranges from 1 to 9, representing lightness or darkness. The top of the chart (9) is the lightest, and the bottom (1) is the darkest. * **Scale of Chromas (Horizontal):** Ranges from 1 to 9, representing the color's intensity or saturation. The left side (1) is the least intense, and the right side (9) is the most intense. * **Hue:** The chart transitions from green on the left to red-purple on the right, representing different hues. The colors within the grid vary systematically based on these three scales. The chart is predominantly composed of shades of green, transitioning through yellow-greens, neutral greens, and eventually into red-purples and purples. There's a neutral gray area labeled 'N' in the center, representing a lack of chroma. Below the chart, there's descriptive text explaining the chart's purpose and the meaning of the scales. The text also includes a copyright notice and the date (June 26, 1909). There is also a warning to avoid dust, handling and exposure to strong light.