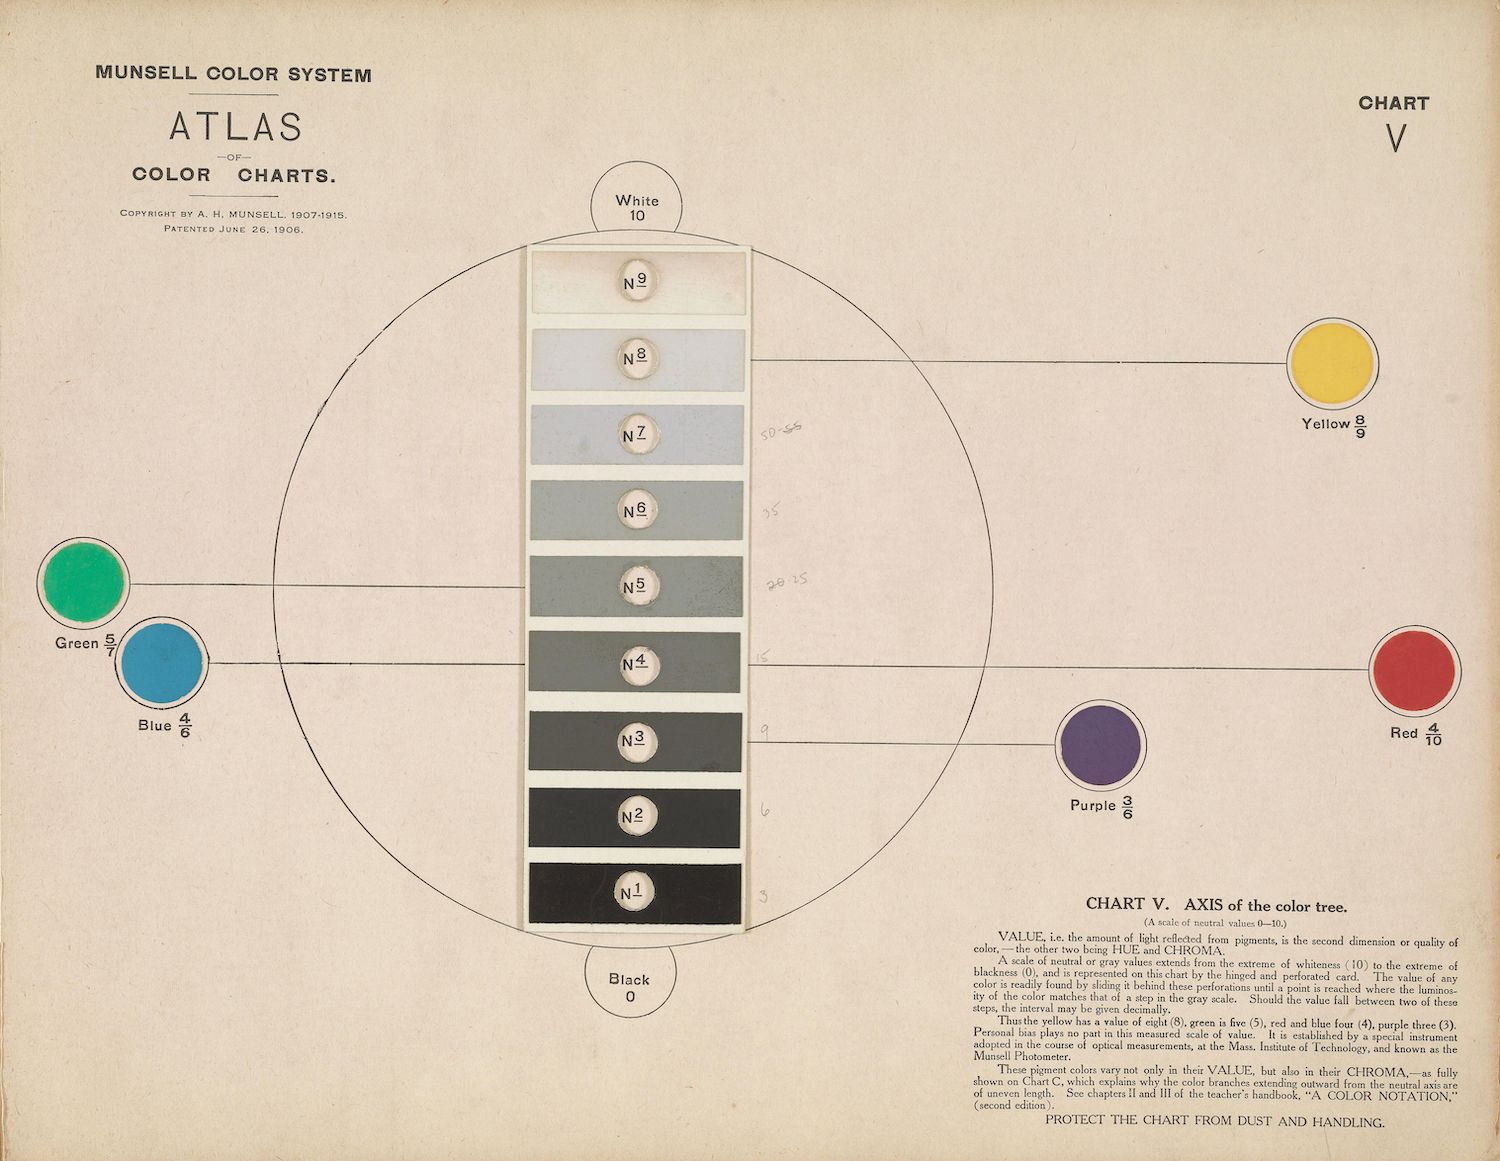
The image is a vintage chart from the Munsell Color System Atlas, specifically Chart V. It's a circular diagram designed to illustrate the relationship between color, value, and chroma. The central area is a color wheel, divided into segments representing different hues: red, yellow, green, blue, and purple. Each hue is further divided into a series of concentric rings, each representing a different 'value' or lightness/darkness. These values are numbered from 10 (white) down to 0 (black). Within each value ring, there are several color swatches, each representing a different 'chroma' or saturation level. The swatches range from desaturated grays to highly saturated colors. Around the color wheel, there are labels indicating the hue, value, and chroma of each color. There's also text explaining the concepts of value, chroma, and hue. The chart is titled 'Munsell Color System Atlas' and includes a copyright notice and patent date (June 29, 1909). The chart is aged and has a slightly faded appearance, typical of vintage documents. There is also a note at the bottom of the chart that says 'Protect this chart from dust and handling'.