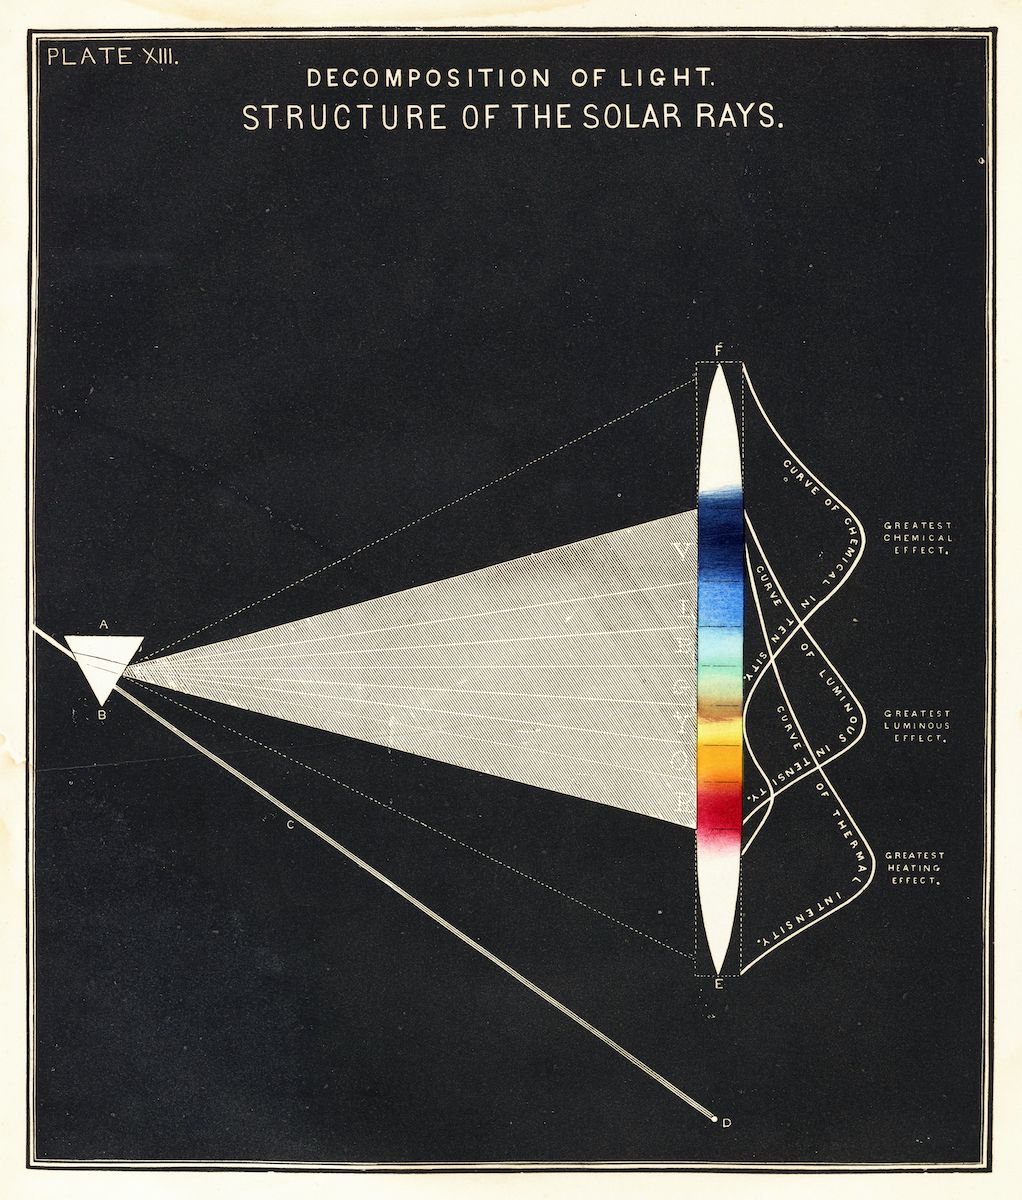
The image is a vintage scientific diagram titled "Plate XIII. Decomposition of Light. Structure of the Solar Rays." It depicts a visual representation of how light is broken down into its component parts, resembling a prism's effect on sunlight. The background is a deep black, creating a stark contrast with the white lines and colors of the diagram. A wide, triangular shape dominates the center, representing the path of light. Within this triangle, numerous straight and curved lines radiate from a central point (labeled 'A'), diverging and converging to illustrate the different wavelengths and properties of light. The right side of the diagram features a spectrum of colors – red, orange, yellow, green, blue, indigo, and violet – arranged in a band. Each color is associated with a specific effect: red with "greatest heating effect," yellow with "greatest luminous effect," and violet with "greatest chemical effect." These effects are indicated by labels and lines extending from the color bands. Various letters (A, B, C, D, E, F, V) are used to label different points and lines within the diagram, likely for reference in accompanying text. The overall style is reminiscent of 19th-century scientific illustrations, with a focus on precise lines and detailed labeling.