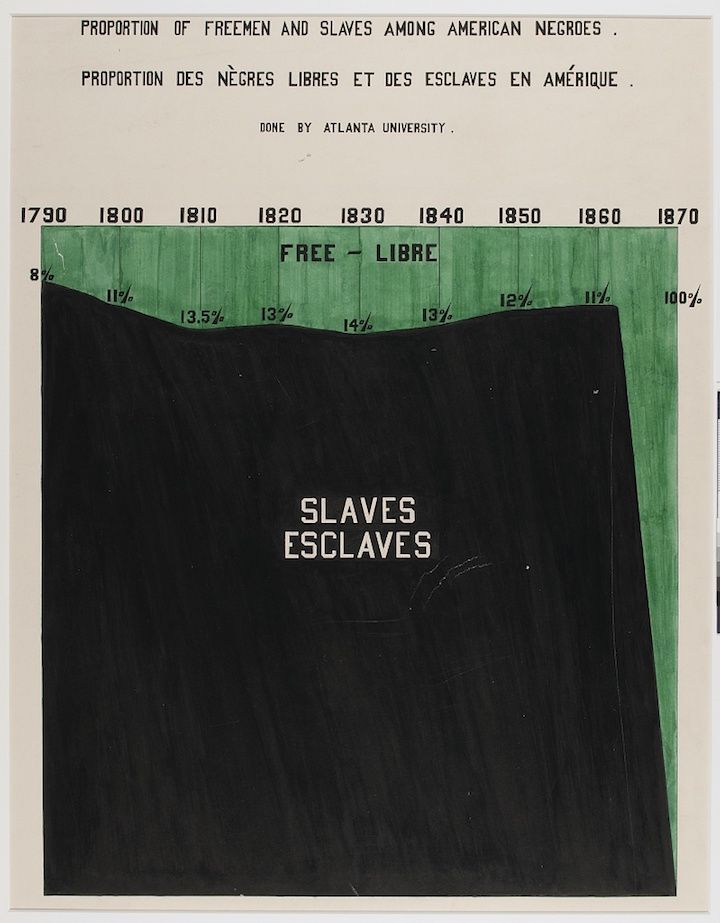
The image is a historical chart or graph titled "Proportion of Freemen and Slaves Among American Negroes" and its French translation, "Proportion de Nègres Libres et des Esclaves en Amérique." It was done by Atlanta University. The chart displays the proportion of free and enslaved people over time, from 1790 to 1870. The chart is a stacked area chart. The top section, labeled "FREE - LIBRE", is a bright green color and represents the proportion of free people. The bottom section, labeled "SLAVES - ESCLAVES", is a dark black color and represents the proportion of enslaved people. The chart shows a gradual increase in the proportion of free people and a corresponding decrease in the proportion of enslaved people over time. Specific percentages are indicated for each year. In 1790, the proportion of free people was 8%, while the proportion of enslaved people was 92% (implied). By 1870, the proportion of free people had increased to 100%, while the proportion of enslaved people had decreased to 0%. The percentages for intermediate years are as follows: 1800 (11%), 1810 (13.5%), 1820 (13%), 1830 (14%), 1840 (13%), 1850 (12%), 1860 (11%). The chart is somewhat faded and has a vintage appearance, suggesting it is an old document or reproduction. There are some imperfections and discoloration on the chart, which are consistent with its age. The chart is a valuable historical document that provides insight into the changing demographics of the African American population during the era of slavery and emancipation.