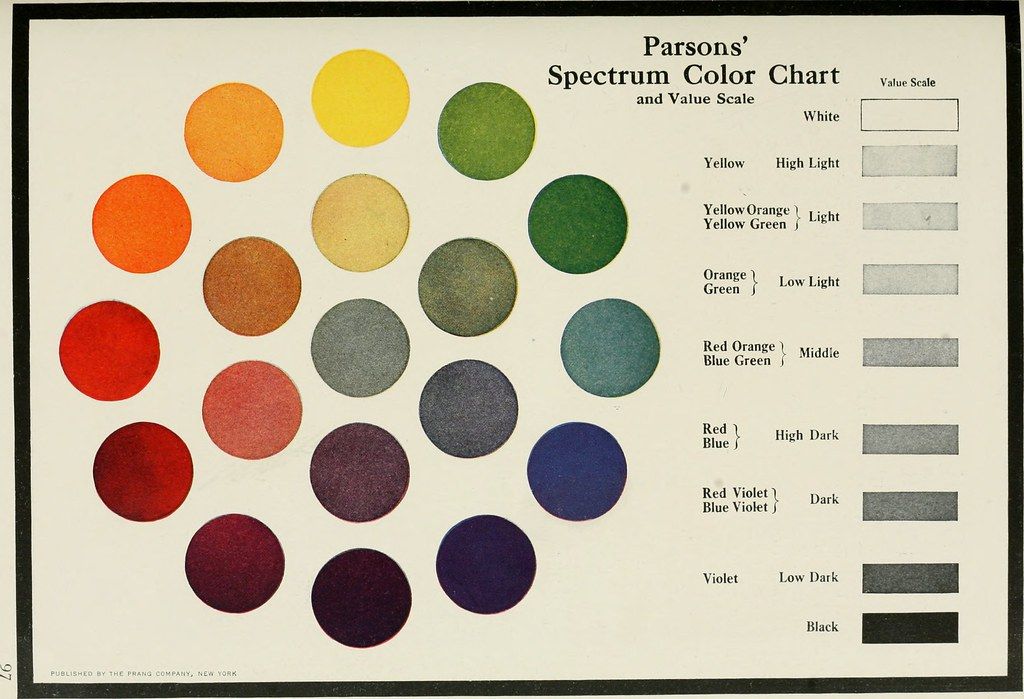
The image is a vintage color chart titled "Parsons' Spectrum Color Chart and Value Scale". It features a circular arrangement of 12 distinct colors, resembling a color wheel. The colors progress through the spectrum, starting with yellow, then orange, red, violet, blue, and green, with variations in between. To the right of the color wheel is a value scale, consisting of rectangular blocks ranging from white to black. Each block is labeled with a corresponding color term and a descriptive term indicating its lightness or darkness (e.g., "White", "High Light", "Light", "Low Light", "Middle", "High Dark", "Dark", "Low Dark", "Black"). The chart appears to be a tool for artists or designers to understand and compare colors and their values. The overall aesthetic is vintage, with a slightly faded and aged appearance. At the bottom of the image, there is text that reads "PUBLISHED BY THE PRANG COMPANY, NEW YORK".