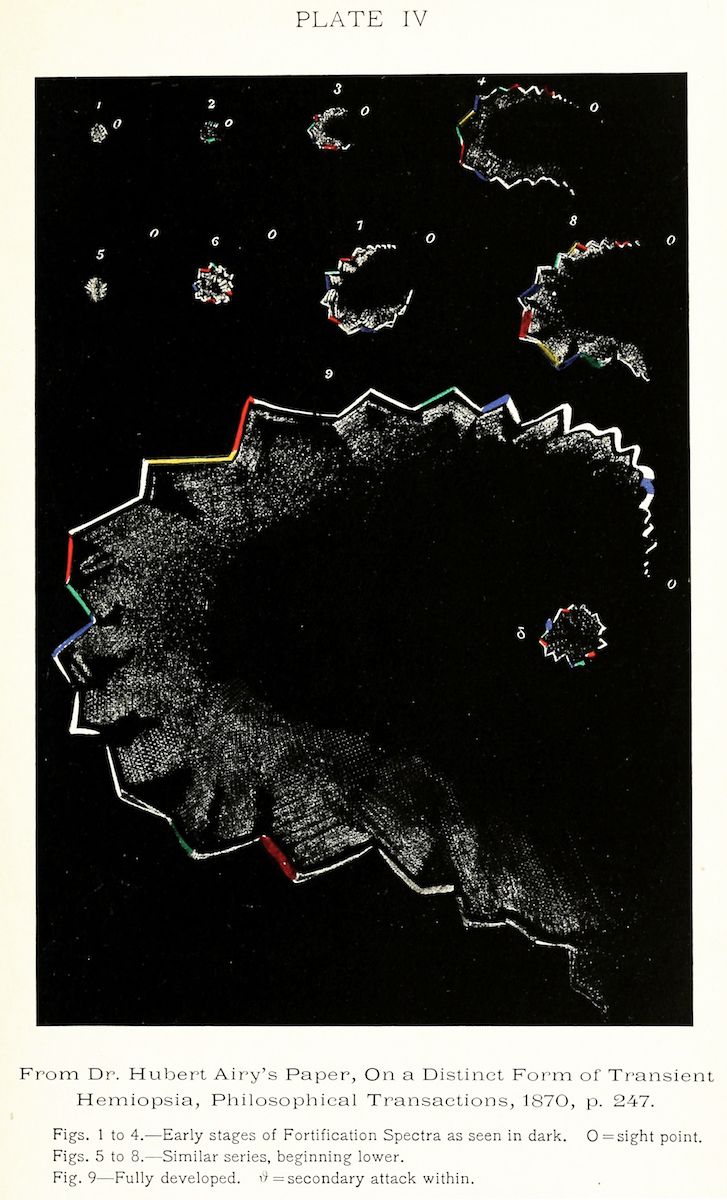
The image is a black and white diagram titled "PLATE IV" with a series of numbered shapes and lines on a dark background. The shapes appear to represent a visual field or a section of the eye, with lines indicating boundaries or areas of vision. There are nine numbered diagrams arranged in a grid-like pattern. Diagrams 1 to 4 are positioned in the upper row, diagrams 5 to 8 in the middle, and diagram 9 at the bottom. Each diagram features a central, irregular shape with a jagged outline, representing the area of vision. Within this shape, there are lines and curves that seem to delineate different zones or areas of visual impairment. Each diagram is labeled with a number and the letter "O", which is indicated as the sight point. Additionally, some diagrams have a red line highlighting a specific area or boundary. The lines and shapes vary in complexity and arrangement across the different diagrams, suggesting a progression or series of stages. Below the diagrams, there is text that identifies the source of the image as Dr. Hubert Airy's paper, "On a Distinct Form of Transient Hemiopia," published in Philosophical Transactions in 1870. The text also provides a description of the diagrams, indicating that they represent early stages of fortification spectra as seen in the dark, with the letter "O" denoting the sight point and the red line indicating a secondary attack within the visual field.